Table 3. Adjustments made for table size. Arrows (<- />) indicate penalties
continue below 50% and above 65% table sizes.
| Table size: | Too Small | Optimum | Too Large |
| <- 50% 53% | 53% - 60% | 60% - 65% -> | |
| Brilliance score | <- 1.0 to 0 | 0 | 0 to 1.0 -> |
| <- 50% 53% | 53% - 58% | 58% - 65% -> | |
| Fire | <- 0.5 to 0 | 0 | 0 to 1.0 -> |
| Scintillation | <- 0.5 to 0 | 0 | 0 to 1.0 -> |
Cross correlation of widely different table sizes shows that this factor has less impact on diamond beauty than is commonly thought (this was also noted in the GIA’s Brilliance study).
A penalty factor for table sizes was applied to each of the beauty factors. (See Table 3). For example a diamond with a table size 62.5% has penalty scores of brilliance 0.5, fire 0.643, and scintillation 0.643, giving an additional penalty of 1.786. This means it is possible for a diamond with an ideal combination of crown and pavilion angles and a 62.5% table to score below two or excellent.
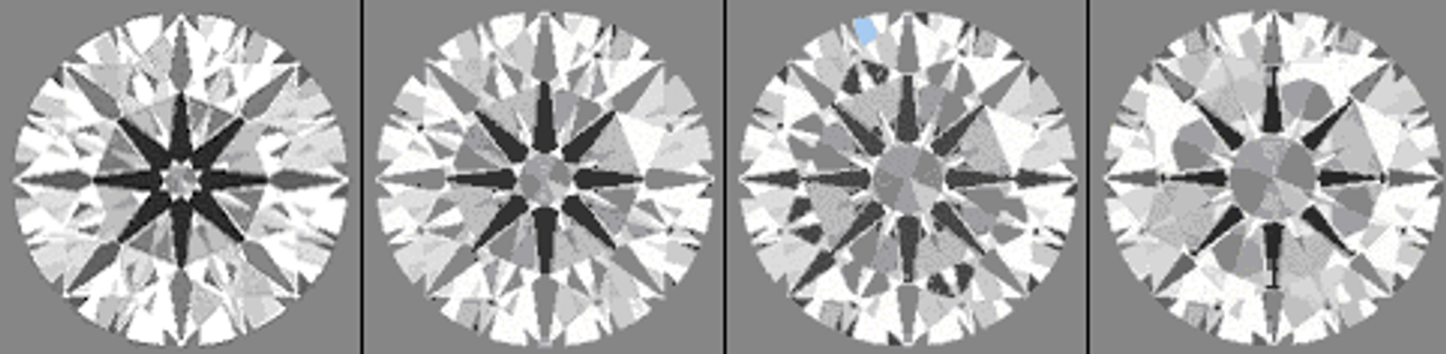
Figure 18. Note the stars becomes thinner as the table size increases. (A side note - the table reflection of the 68% table diamond indicates it has the deepest pavilion. But all 4 images have identical crown and pavilion angles. Liddicoat’s widely used ‘Rapid sight estimates’ method, for visually estimating pavilion depth based on the size of their table reflections, does not work. Variations in crown angle introduce another error. It is paradoxical that the main reason the trade quotes pavilion data as a % and crown in degree’s is because of the mistaken belief that experts could accurately estimate pavilion depth %. The industry must change and drop Pavilion % and begin to use angles.)
It can be seen that as table size increases the black stars in the stones are seen to become thinner and less well defined. (We know a method for compensating this effect.)